Custom Search
Showing posts with label power charts. Show all posts

Wednesday, February 10, 2010

Coffee Crew 02/09/10

Here is the Training Peaks 3.0 screen shot of my Coffee Crew ride.  It was medium paced because the ground was still wet from the rains the night before.  I rode better than I thought I would considering I had done the 300km (180 miler) three days before.


SCREEN SHOT OF TRAINING PEAKS WKO 3.0
it's new GET IT!

Tuesday, January 26, 2010

Sunday Century with friends


I had intentions of riding Palomar Mountain on my only day off.  I had worked six days this week and wanted something other than riding the local roads.  But after I sent out an email about my intentions some riders reported that there was ice on the upper slopes of Mount Palomar.  So instead I met with Dave Elsberry and we did a century at a good fast pace in Orange County. 

Our century had lots of rolling terrain and some good climbs I hadn't ridden before.  We had a good ratio for the first 40 miles-- 40 miles 4,000 feet of gain. At some point the climbing was less per mile but the intensity made up for it.  I think we are pretty evenly paced and make good riding partners.  I faded on the last 10 miles but I think I just didn't fuel properly.  I guess I thought "what's the big deal? It's just a century."  I also flatted twice one rear caused by debris in the bike lane and the other a front flat while descending Sliverado Canyon.

Power Numbers

Entire workout (156 watts):
Duration: 6:12:36
Work: 3491 kJ
TSS: 418.4 (intensity factor 0.823)
Norm Power: 206  (3 w/kg for 6 hours)
VI: 1.32
Pw:HR: 10.26%
Pa:HR: -7.75%
Distance: 101.18 mi
Min Max Avg
Power: 0 980 156 watts
Heart Rate: 7 191 157 bpm
Cadence: 30 212 84 rpm
Speed: 2.2 40.7 16.7 mph
Pace 1:28 26:49 3:36 min/mi
Crank Torque: 0 1007 162 lb-in


Training Peaks 3.0 screen shot from my Power Tap Download
I avgd 3.6 w/kg in my first hour because I was riding with a former pro Sean Nealy


Friday, October 9, 2009

Power Charts from Training Peaks


PERFORMANCE MANAGEMENT CHART

First up is the Performance Management Chart.  Notice how my Blue line is declining, my Pink line is declining and my Yellow line is rising.  In laymen terms this is what this chart should look like before a major or goal event.  Blue line is my Chronic Load or my level of fatigue for the last 6 weeks.  The Pink line is the amount of stress that I am putting on my body on a weekly basis.  And the Yellow line is the amount of rest or the balance between the stress and the rest -- or adaption to that stress.  It gets more technical than that but you would like to see the Yellow line rising with the Blue line declining so that you are fit and rested for your goal event. 


2009 FURNACE CREEK 508 PART 1


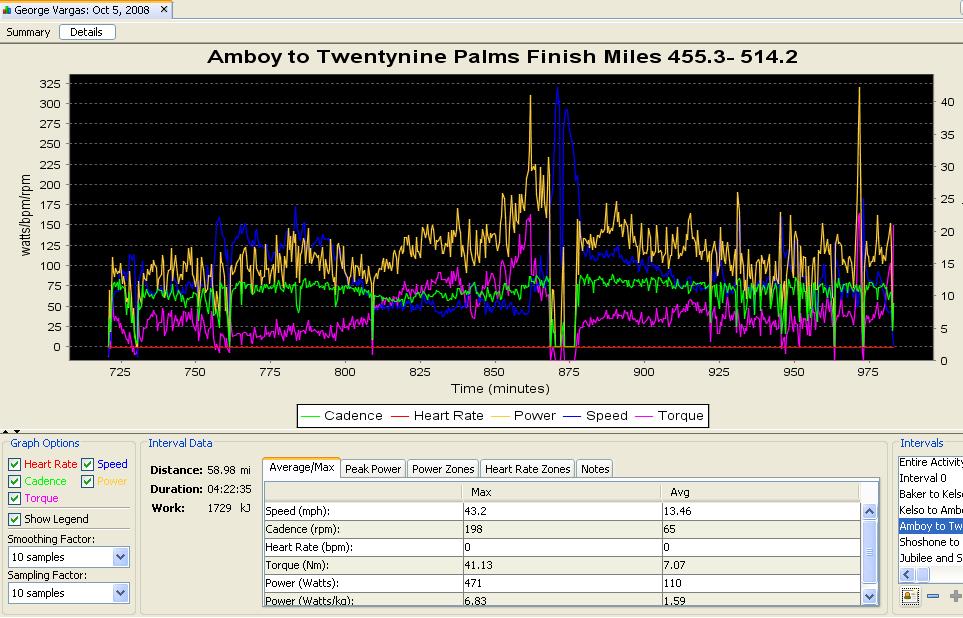
Next up is the first 29 hours and 50 minutes of my Power Tap download into TraningPeaks software.  The CPU memory is only 30 hours so I have to use two CPU's.  I guess they don't expect Ultracyclists to be using power meters for more than 30 hours;)  Well maybe someday I'll get faster at the 508 and won't need to CPU's.  You'll see modest numbers because I had to conserve a lot of energy going through Death Valley not knowing what was looming for the next 200 miles of the course. 


2009 FURNACE CREEK 508 PART 2

And now Part 2.  The remaining 7 hours and 42 mins.  More modest numbers because heck I'm getting tired now;) 

But what about this number 15,758 kjs-- yeah that's huge!

kjs are like calories and significantly more accurate measurement of energy expenditure when taken from your power meter than when taken from your heartrate monitor calorie calculator.  My guess is those looking at their heartrate data might have as much as 20,000 calories on their watch.


Thursday, July 30, 2009

New 5 Min Numbers

I was feeling pretty good last night during my commute--amazing what two days off the bike will do for your recovery. During my 69 mile commute I sometimes take a detour and climb a 1.5 mile 6% hill named Newport Coast Dr. Last night I wanted to see if my 5 min number had improved since my last "field test" over a month ago.


HERE IS A SCREEN SHOT FROM TRAINING PEAKS

I weighed 150lbs or 68 kg

my NORMALIZED POWER was 340


340/68 = 5 w/kg

Not bad for an amateur. According to the Coggan power profile chart it is in the grey area between Cat 3 and Cat 2.


source

Tuesday, July 14, 2009

oops found another one for Little GMR

Found another one where I am 28 seconds faster on Little GMR. So I think my goal is to beat 29 minutes at first and then work from there.


Could be my Little GMR PR?

I need to look at my older files but I think this is my PR on little GMR.


HERE IS A SCREEN SHOT FROM TRAINING PEAKS.

Notice I put a powerband between 240-260 watts. My goal was to climb at 3.5 w/kg I did well in keeping at my goal with an actual of 3.6 w/kg.

Thursday, June 11, 2009

20 min peak power on my commute this morning...


^^SCREEN SHOT JUNE 11, 2009^^


20 minute Peak Power from my morning commute. Weight 152 lbs or 69 kg

Average Power 244 watts / 69 kg 3.53 w/kg

Normalized Power 254 watts / 69 kg 3.68 w/kg


Look at my wattage from last night's commute. What I would like for you to notice is that my Average Power was up a whopping 24 watts but my Normalized Power was only up 5 watts from 249 to 254 watts. Why is that?

Let's look at Normalized Power :

TrainingPeaks uses a special algorithm to calculate an adjusted or normalized power for each ride or segment of a ride (longer than 30 seconds) that you analyze. This algorithm is somewhat complicated, but importantly it incorporates two key pieces of information: 1) the physiological responses to rapid changes in exercise intensity are not instantaneous, but follow a predictable time course, and 2) many critical physiological responses (e.g., glycogen utilization, lactate production, stress hormone levels) are curvilinearly, rather than linearly, related to exercise intensity, By taking these factors into account, normalized power provides a better measure of the true physiological demands of a given training session - in essence, it is an estimate of the power that you could have maintained for the same physiological "cost" if your power output had been perfectly constant (e.g., as on a stationary cycle ergometer), rather than variable. Keeping track of normalized power is therefore a more accurate way of quantifying the actual intensity of training sessions, or even races.


Source

In other words, when you apply power to the pedals it takes time for your body to react and when it does it reacts on a curve not in a straight line. Normalized Power takes this into account.

Or like my friend Sushi Joe says it "NP = the power you could have put out if you kept the effort as steady as possible. "

So back to my ride from last night. Notice how the POWER line is more erratic with rollers and traffic signals.


^^SCREEN SHOT JUNE 10, 2009^^

Compare it to this morning's ride was not as variable the power was more consistent so the Normalized Power only increased by 5 watts from 249 watts to 254 watts.

Wednesday, June 10, 2009

20 minute number from my commute

On my commute tonight I did a 20 minute interval. My weight was 152lbs or 69 kg

Here is a screen shot from Training Peaks.


Power: YELLOW
Heart Rate: RED
Speed: BLUE
Cadence: GREEN

My Average Power was 221 watts / 69 kg = 3.20 w/kg
My Normalized Power was 249 watts / 69 kg = 3.60 w/kg

I felt good during the interval but after it I was spent for nearly 10 minutes. The interval was through a section that had traffic signals and a couple of rollers hence the spikes in power.

Sunday, June 7, 2009

60 min Peak Power Number


Screen shot from Training Peaks.

Yellow- Watts
Red - Heart Rate
Green - Cadence


I only had 1.5 hours to ride this morning. I did a 25 mile loop that took me on fairly flat terrain before and after a 1.5 mile hill (Newport Coast Dr) that gains 472 feet with an average grade of 6% grade. After the crest there is a 5.2 mile (San Joaquin Hills) rolling descent. It requires a lot of work to keep the watts up on the descent which in the end hurts your 60 minute number. But it's a good little game to play trying to keep the power up on the descent.


My Normalized Power was 233 watts for 60 mins. My weight was 150lb or 68.04 kg.

233/68.04 = 3.42

My 60 min peak number was 3.42 w/kg.

Average Power was 211 watts

211/68.04= 3.10 w/kg

Based on the Power Profile Chart that is right between the top range of Cat 4 (3.38 w/kg) and the low range (3.47 w/kg) of Cat 3.

Friday, June 5, 2009

New 30 sec Peak Power Number

I have a little competition going with my friend in Omaha, Nebraska SushiJoe.


Last night on my commute I asked him what his 30 second and 1 minute numbers were in absolute wattage and w/kg. I needed a carrot. I needed something to motivate me because the headwinds were demoralizing me. Have I mentioned how much I hate headwinds? I beat his 30 second number in absolute watts and in watts per kg (w/kg)as well. When reading power data it is important to not focus on the absolute numbers so much.


Here is an example. Two cyclists are comparing their wattage output on a local hill of 1.5 miles 6% grade.

John says: "I can hold 275 watts on that climb"

Mary says: "Really? I can only hold 225 watts on that climb"

Who is the stronger cyclist on this climb? Let's take a look at body weights for these two riders.

John weighs 165 lbs or 78.84 kg

Mary weighs 125 lbs or 56.70 kg


So John's w/kg is 275 watts divided by 78.84 kg = 3.67 w/kg

Mary's w/g is 225 watts divided by 56.70 kg = 3.96 w/kg

On this particular climb, based on their weight and power output, Mary is the stronger cyclist because her w/kg for this climb is 3.96 w/kg.

An important concept to remember is that w/kg is a power to weight ratio. As you lose or gain weight your w/kg will change that seems obvious right? But far too many people try to buy their way into better climbing. If you want to improve your climbing lose weight. Typically you will continue to hold your absolute wattage output if you are shedding fat pounds and retaining lean muscle.


Above is a screen shot from Training Peaks. You will see on the left a small frame that shows a time frame and corresponding wattage. The only thing missing to make the data quantifiable is my weight. I weighed 150 lbs yesterday which is 68.04 kg.

My 30 sec peak power was 721 watts or 10.6 w/kg Sushijoe's number was 7.91 w/kg. Ok Sushijoe there is your carrot. You have to beat 10.6 w/kg.

Being an Ultra cyclist, I am a slow twitch type of rider. I rarely do group rides. It is especially important for me to work on my fast twitch muscle so as not to lose that snap in my legs.

Wednesday, March 18, 2009

Starting my commuting again...

On Tuesday 3/10 I began my nightly commute from Encinitas to Huntington Beach. I added an extra climb and now my commute is 68.5 miles.

I then return to work in the morning using the Metrolink Train and get 32 miles.

Last week I ended up with 400+ miles. The first time I have done that mileage since last August when I was finishing up my ramp up for the Furnace Creek 508

For you Power Mongrels -- I expended 10,491 kjs and a TSS of 1426.


Today Wednesday 3/18 I will begin my commute for this week.

Saturday, October 11, 2008

Now the Data Geek in me...

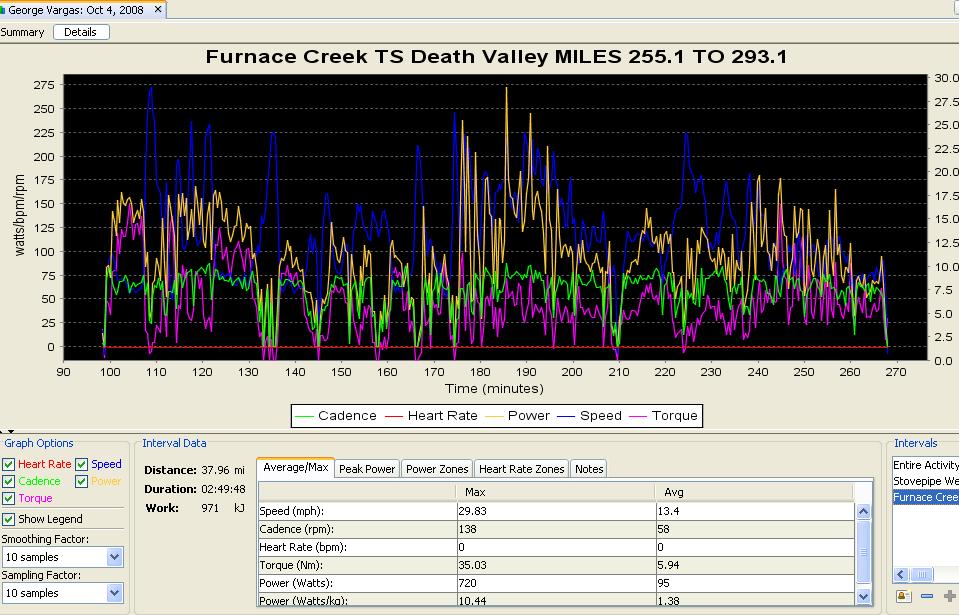
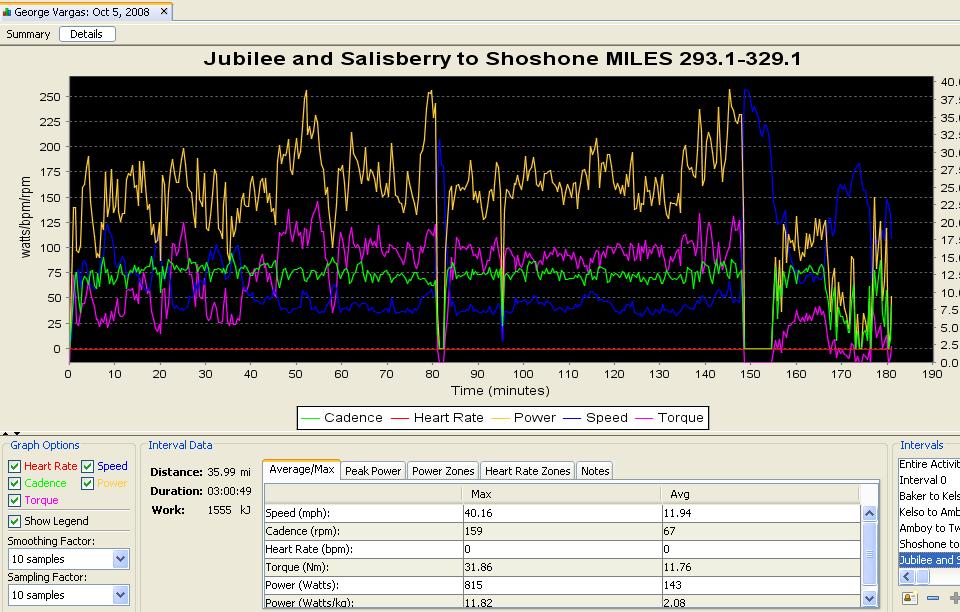
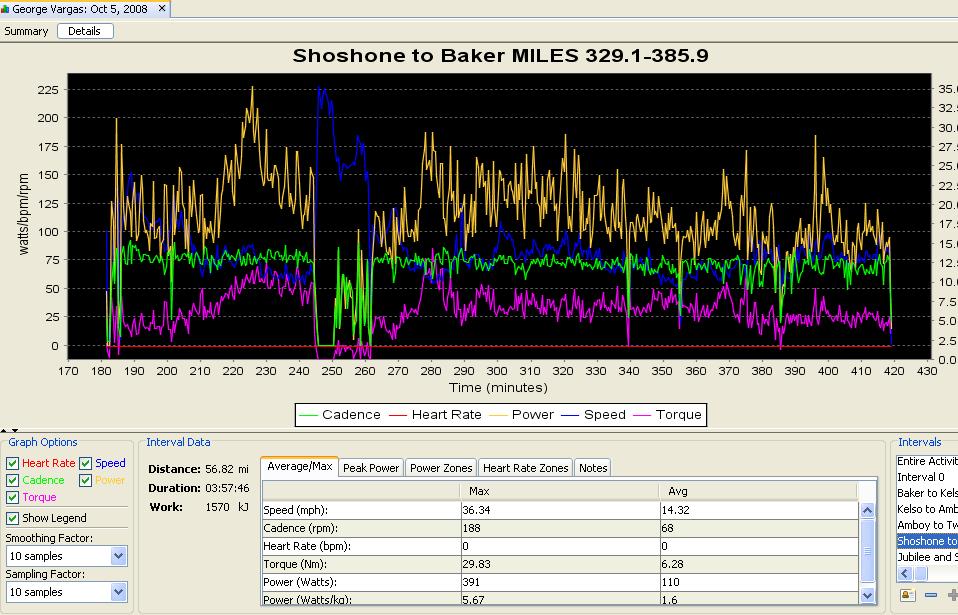
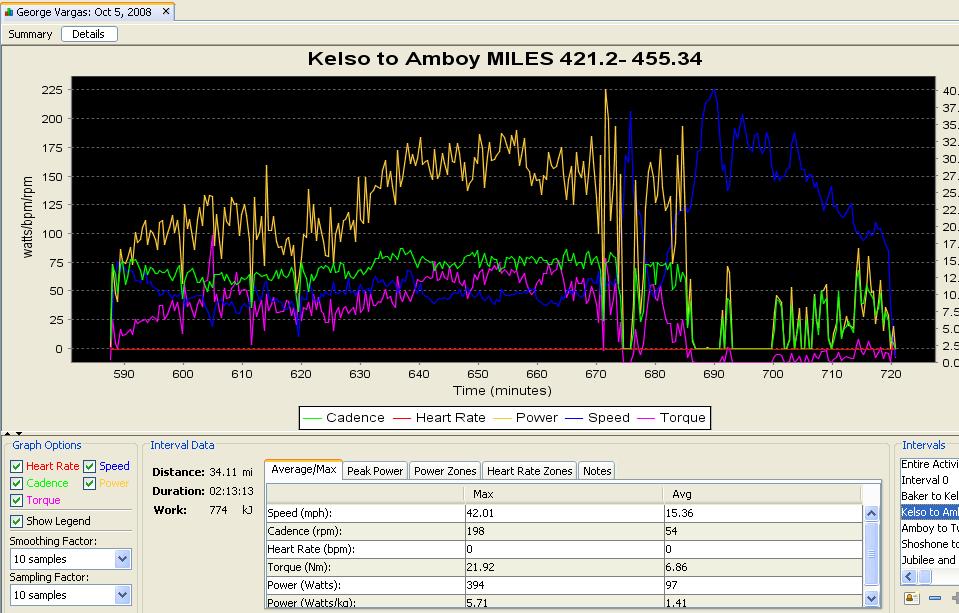
THIS BLOG IS UNDER CONSTRUCTION PLEASE CHECK BACK FREQUENTLY AS I UPLOAD MORE GOOD STUFF


THIS BLOG IS UNDER CONSTRUCTION PLEASE CHECK BACK FREQUENTLY AS I UPLOAD MORE GOOD STUFF


THIS BLOG IS UNDER CONSTRUCTION PLEASE CHECK BACK FREQUENTLY AS I UPLOAD MORE GOOD STUFF